Network Tests
|
grandMA3 User Manual » Networking » Network Tests
|
Version 2.4 |
When the network is built and the devices are connected, different tools can help troubleshoot or gather information about the network.
Flow Control Level
The flow control number shows information about congestion and data loss in a session. It displays, on a scale of 0 to 255, the intensity of flow control. The higher the number, the more congestion at the station. If the number is above 0 for a prolonged time, then it could indicate a lack of bandwidth in the network, a bad connection, or a poorly configured network switch.
The flow control level number can be seen in the Stations tab in the Network menu.
Nack Count
Another indicator of the network status is also found in the Session view in the Network menu. On the Global Master of the session, a Nack count can be seen for the connected stations.
Nacks are negative acknowledgments. Nacks can happen when network packages fail to get through the network properly.
There are four different numbers. The first three show the number of nacks in the last minute, five minutes, and 10 minutes. If these numbers are consistently above 0, then some issues prevent network packages from being transmitted between the master and the station - for instance, a bad connection or missing bandwidth (overflow of packages).
The last number shows the total amount of nacks since the session started or since it was last reset.
NetworkSpeedTest Command
Using the command line, a network speed test can be performed. This gives an indication of the connection from the devices used to perform the test to the devices being tested. This means when the test is performed by a console, to all the processing units (PU) in the network, then the result indicates the connection speed between the console and each processing unit.
The test does not have a dedicated graphical user interface. The test is performed using the NetworkSpeedTest keyword in the command line input. The result from the test is displayed in a pop-up.
The test can be performed on specific devices based on their device type number or name. It is also possible to test the connection to all the devices in the session.
The following devices can be tested:
- Console
- onPC
- ProcessingUnit (PU)
- NetworkNode
The list of devices can be seen in the Stations tab in the Network Menu. Here, the devices are organized in sections with the different types. The device number can be seen in the "No" column. The name is in the "Name" column.
An alternative way to see a list of the devices, including their numbers and names, is with the Command Line History window and the List Keyword.
For example, to list all the consoles in the network, execute the following command:
|
|
User name[Fixture]>List Console |
The syntax to test a specific device is NetworkSpeedTest [DeviceType] ["Device_Name" or Device_Number]
Example testing the network speed to console number 1:
|
|
User name[Fixture]>NetworkSpeedTest Console 1 |
Example testing the network speed to an onPC named "Main-Backup":
|
|
User name[Fixture]>NetworkSpeedTest onPC "Main-Backup" |
The syntax to test all devices of a specific type is NetworkSpeedTest [DeviceType] Thru
It is possible to test all the devices in a session with one command.
The syntax to test all devices in a session is NetworkSpeedTest Session ([Session_Number])
If the number is omitted, then the session number for the station is used.
Example testing the network speed for all devices in session number 2:
|
|
User name[Fixture]>NetworkSpeedTest Session 2 |
Example testing the network speed for all devices in the current session (for the station executing the command):
|
|
User name[Fixture]>NetworkSpeedTest Session |
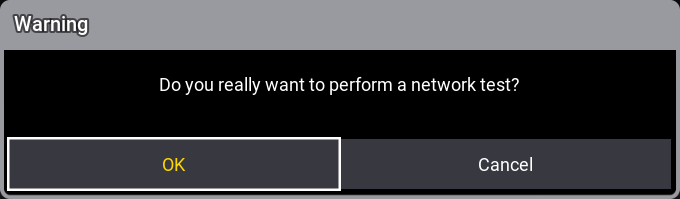
When the command is executed, a pop-up appears asking for confirmation that the test should be performed.
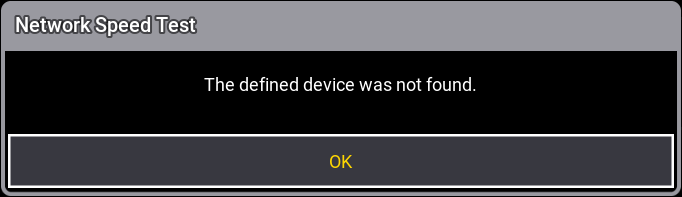
If the requested device is not found in the network then a pop-up like this is shown.
If the device is found, a pop-up will appear showing the result.
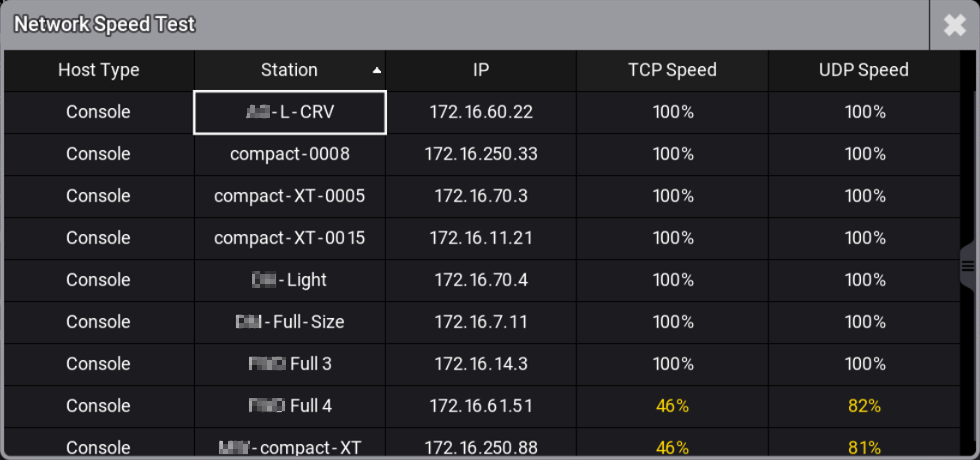
It has the following columns:
-
Host Type:
This is the device type. -
Station:
This the name of the device. -
IP:
This is the IP address for the device. -
TCP Speed:
This displays the speed of the TCP packages. It is shown as a percentage. -
UDP Speed:
This displays the speed of the UDP packages. It is shown as a percentage.
The result cannot be exported, saved, or recalled. This pop-up is the only way to see the result.
- A result close to 100% indicates optimal performance.
- A percentage significantly lower than 100% may suggest a device experiencing connectivity issues or other system-related challenges.
- If all devices show a similar percentage, that is a good sign. The network is likely functioning consistently.
- If one device shows a much lower percentage than the others, it is worth taking a closer look at that specific device to ensure everything is working properly.
The test can help identify potential issues so that a smooth and reliable network experience can be maintained.