|
grandMA3 User Manual » System » System Information
|
Version 2.4 |
System Info combines system and performance monitoring for the console.
To add a System Info window, follow the instructions under Add windows.
In the Add Window pop-up:
- Tap More.
-
Tap System Info.
The System Info window opens.
To adjust the System Info window settings, follow the instructions under Window Settings.
Temperature Check
CPU, GPU, and system temperatures can be displayed on:
- grandMA3 full-size
- grandMA3 light
- grandMA3 replay unit
- grandMA3 compact XT
The grandMA3 compact can only display CPU and system temperatures.
These products are not able to display temperature information:
- grandMA3 extension
- grandMA3 processing unit
- grandMA3 nodes
- grandMA3 viz-key
- All grandMA3 onPC solution devices
Fan Check
The fan view in the System Info window displays the system/CPU cooling fan speed in correlation to its maximum speed.
Fan speeds can be displayed on:
- grandMA3 full-size
- grandMA3 light
- grandMA3 replay unit
- grandMA3 compact (XT)
These products are not able to display fan speed information:
- grandMA3 extension
- grandMA3 processing unit
- grandMA3 nodes
- grandMA3 viz-key
- All grandMA3 onPC solution devices
System Info is divided into different views, which can be selected using the button in the title bar on the right-hand side.
Tap and hold the button to toggle between:
- Realtime: Displays the system's workload in milliseconds per DMX frame.
- Timing: Displays the time required to render the console screens. MainLoop, Swap, and End show the internal processing and the displays on which it takes place.
- CPU: CPU displays the workload of the main processor.
- Memory: Displays the system's RAM in GB.
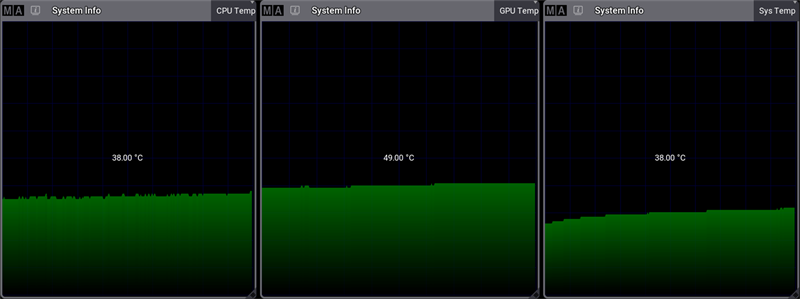
- CPU Temp: Displays the console's current temperature.
- GPU Temp: Displays the current temperature of the console's graphics processing unit.
- Sys Temp: Displays the current temperature of the central computer board.
- Fan: Displays the cooling system fan's rotational speed in RPM.
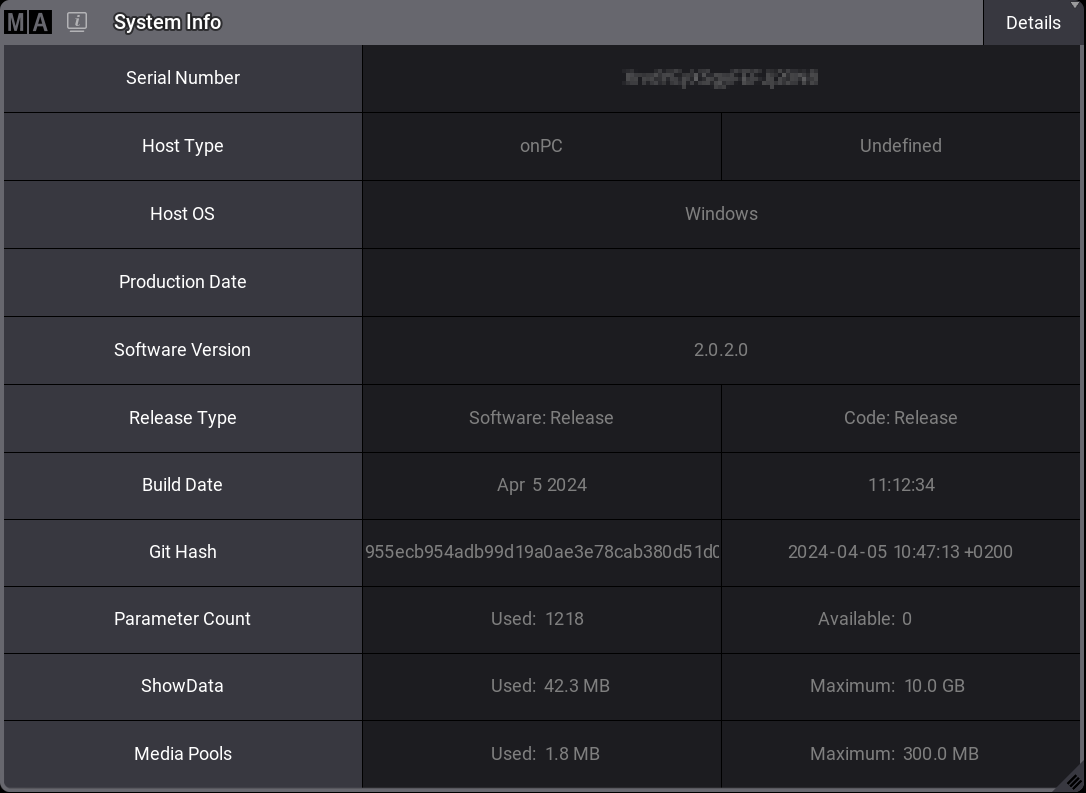
- Details: Displays other relevant system info, such as the serial number or the build date.
- HDD: Lists relevant information about available hard drives.
- Network: Lists the number of connected and expected stations in the session. Green numbers show the expected numbers of devices. Red shows when a device is disconnected.
|
|
Hint: |
| Graphs such as the Memory graph show the current used value on the left and the total value on the right. |
The title bar can be enabled or disabled by tapping Show Title Bar in the System Info Window Settings.