Message Center
|
grandMA3 User Manual » System » Message Center
|
Version 2.3
|
The message center displays information on processes in the software.
It also allows you to configure the information displayed on your screens.
The message center is divided into two categories:
- Messages
The messages section displays messages produced by the system. - Status
Configure how status icons are displayed in the command line in the status section.
Read more about these two sections below, under Messages and Status.
Open the Message Center
To open the message center window, tap Message Center in the More tab in the Add Window pop-up. For more information on adding windows, see Add Window.
To open a temporary version of the message center:
-
Tap the envelope icon (
 ).
).
- Tap any of the status icons on the right side of the command line.
To close the temporary message center, tap one of the icons in the command line again or tap ![]() in the upper right corner of the window.
in the upper right corner of the window.
To select a different screen to display the message center:
- Tap
 in the title bar.
 - Tap the screen you want to display the message center on.
The message center is displayed on the selected screen every time you open a temporary version of the message center. To reset the display selection to default, tap ![]() and then tap Clear.
and then tap Clear.
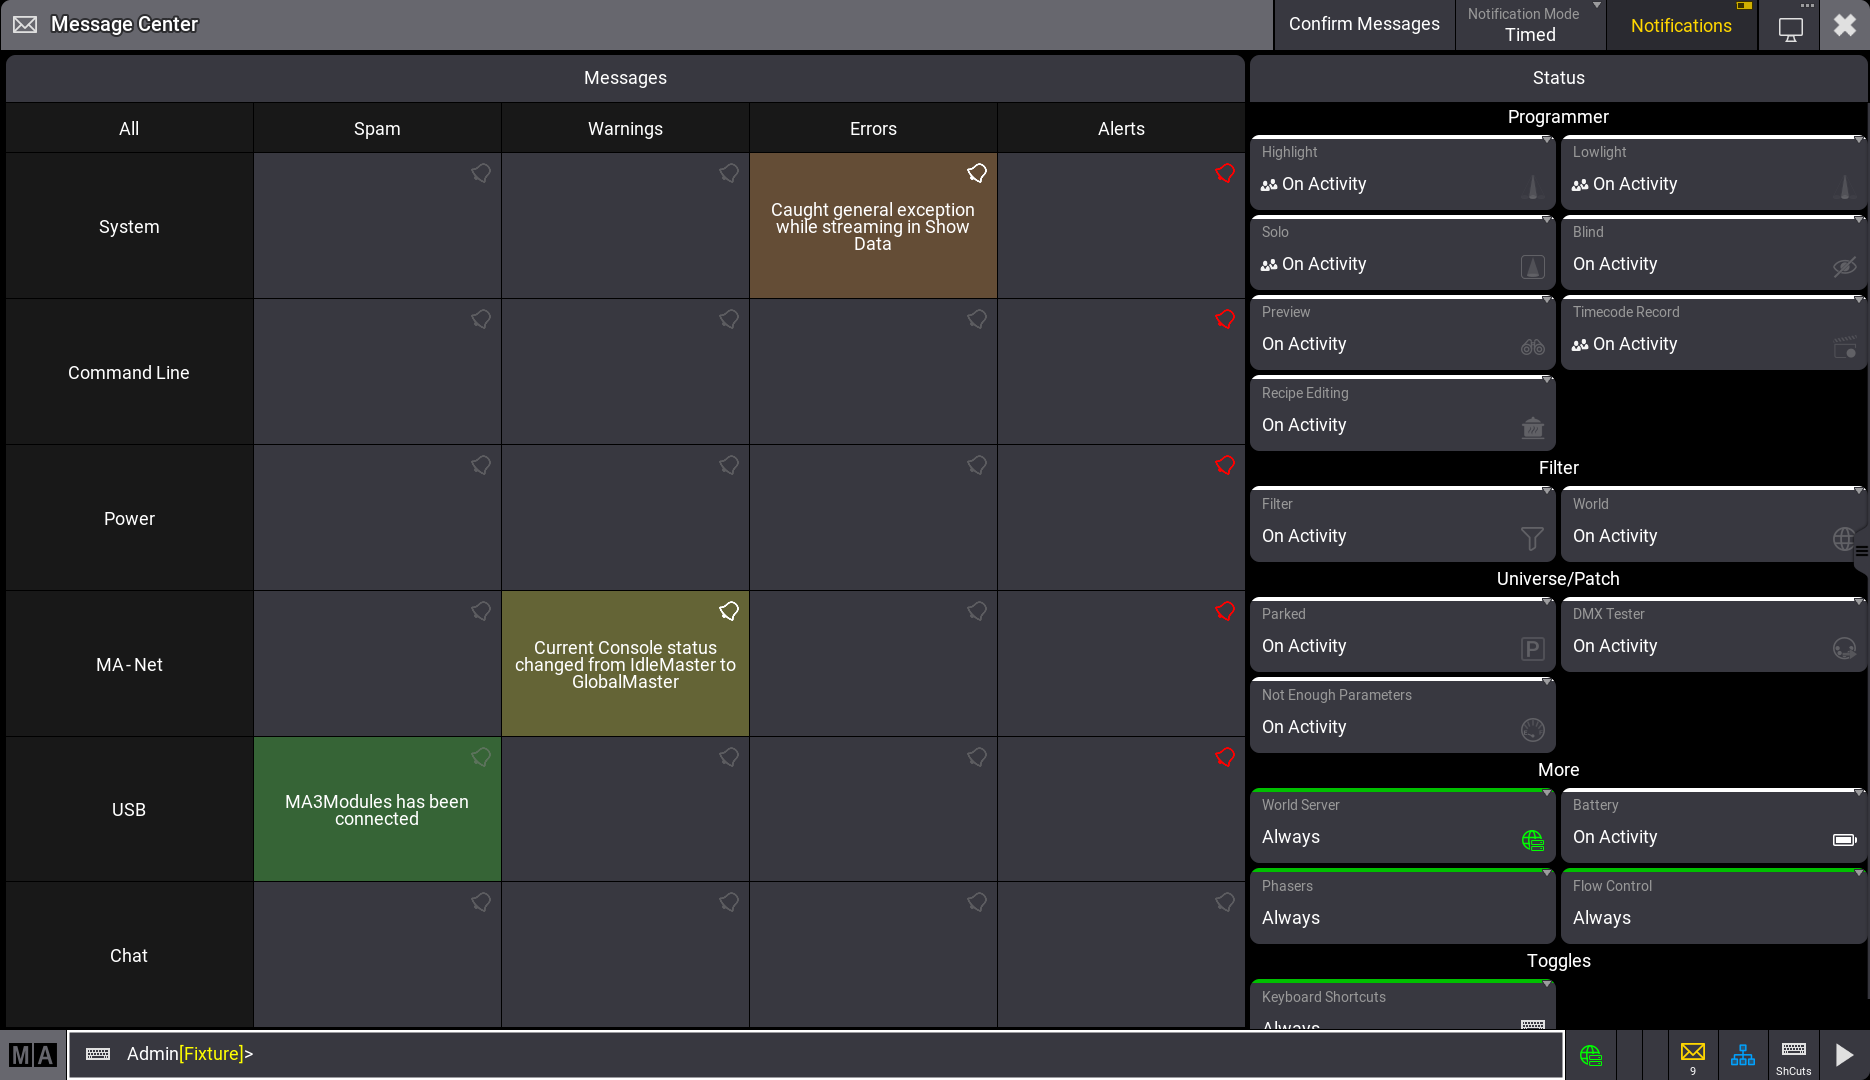
Messages
The messages section displays messages produced by the system.
The envelope icon (![]() ) on the right side of the command line changes color to indicate new messages in the message center.
) on the right side of the command line changes color to indicate new messages in the message center.
The icon is displayed in the color of the new message with the highest priority.
A number underneath the envelope icon indicates the number of new messages, except spam messages.
The categories for messages are:
- System
- Command Line
- Power
- MA-Net
- USB
- Chat
Messages have different priorities.
- Spam (green): Information about internal system processes that generally don't require user activity or input.
- Warning (yellow): Information that is important and should be taken care of.
- Error (brown): Information on invalid actions and malfunctions in the software.
- Alert (red): Information on critical events. Messages in the alert category generally require immediate action.
When a new message is received, the background of the cell flashes.
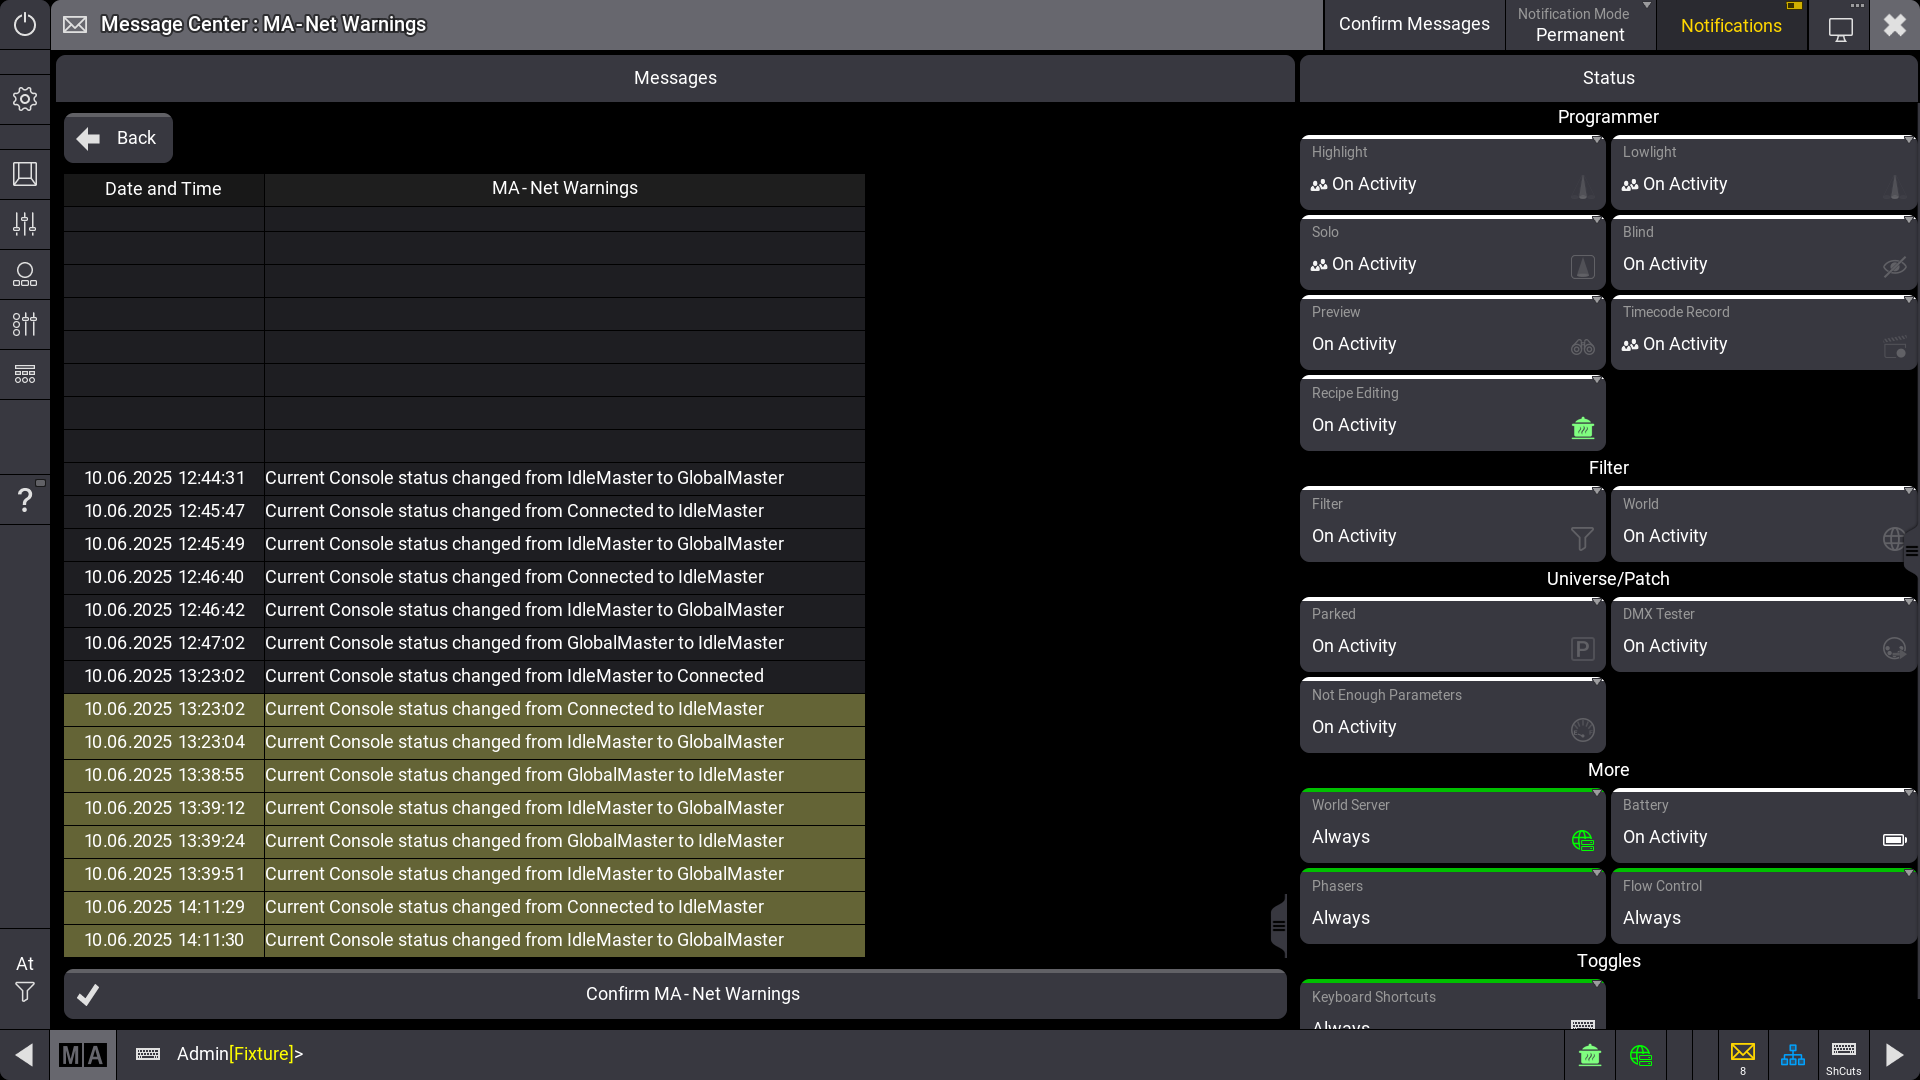
To display all messages in a category, tap on the corresponding cell.
A window opens, displaying a list of the messages as well as information about timestamp and sender.
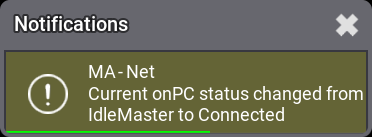
Notifications for Messages
Messages in the message center can be displayed as notifications in the software.
To select whether you want notifications displayed, toggle Notifications in the title bar of the message center.
Notifications are enabled by default.
Each cell in the message center has a bell icon (![]() ) in the upper right corner to select a notification type.
) in the upper right corner to select a notification type.
The color of the icon changes depending on the type of notification.
The three options are:
To select the type of notification for a category, tap the bell icon to toggle through the options or swipe the icon to display a drop-down list with all three options.
The color of the icon changes depending on the notification type.
The background color of notifications matches the color of the priority. Additionally, an icon is displayed in the notification, indicating the priority.
- Spam:
 and green background
 - Warning:
 and yellow background
 - Error:
 and brown background
 - Alert:
 and red background
Select how long a notification is displayed using Notification Mode in the title bar.
The two options are:
- Timed: Notifications are displayed for 5 seconds.
- Permanent: Notifications are displayed until they are closed.
Confirm Messages
Confirm messages to mark them as read in the message center. Confirmed messages are no longer displayed in the cells in the message center but can still be accessed by tapping the cell.
- To confirm all messages in the message center, tap Confirm Messages in the title bar of the message center.
- To confirm all messages of a category, tap on the cell in the message center. Then tap the corresponding Confirm button below the messages.
- To confirm single messages, tap on the corresponding cell in the message center. Then tap the message you want to confirm.
Status
Status icons indicate activities and statuses in the software. They are displayed on the right side in the command line next to the command line input field.
All status settings are set per user profile. For some statuses you can choose to see the corresponding status of all user profiles.
To show or hide a status icon in the command line, swipe the status in the message center.
A drop-down
displays
the
following options:
- Never: No icon for the status is displayed. The indicator bar of the corresponding status is gray.
- On Activity: Displays the icon when a setting or function is active. The indicator bar is white.
- Always: The icon is always displayed in the command line. If the setting or function is not active, the icon is grayed out. The indicator bar is green.
The default display mode for statuses in the Programmer and Filter section is On Activity.
The default display mode for statuses in the More and Toggles section, except for Battery, is Always. The default
for Battery depends on the device.
For some statuses (Highlight; Lowlight; Solo; Timecode Record) you can select different sources for the status in the drop-down:
- My: The status is active if triggered by the current user profile.
- All: The status is active if triggered by any user profile. When All is enabled, a small icon
(
 ) appears in
the status cell.
) appears in
the status cell.
| Hint: | |
| If the user profile is set to All and highlight, lowlight, solo, or a timecode record is triggered by another user profile, ext or my+ext is displayed below the icons. ext is displayed if the function is only triggered by another user profile. my+ext is displayed if the function is triggered by both the current and another user profile. If the function is triggered by the currently active user profile, no text is displayed below the icon. |
The following statuses can be displayed in the command line:
Programmer:
- Highlight (
 ):
Highlight is active. Tap the icon to open the master controls.
):
Highlight is active. Tap the icon to open the master controls.
- Lowlight (
 ):
If Lowlight is active, the icon turns blue. Tap the icon to open the master controls.
):
If Lowlight is active, the icon turns blue. Tap the icon to open the master controls.
- Solo (
 ):
Solo is active. Tap the icon to open the master controls.
):
Solo is active. Tap the icon to open the master controls.
- Blind (
 ):
Blind is active. Tap the icon to open the master controls.
):
Blind is active. Tap the icon to open the master controls. - Preview (
 ): Preview is active.
- Timecode Record (
 ): A timecode recording is active. When a timecode is recorded, the icon starts to
blink. Tap the icon to open the off menu in the timecodes tab.
): A timecode recording is active. When a timecode is recorded, the icon starts to
blink. Tap the icon to open the off menu in the timecodes tab.
- Recipe Editing (
 ): If the
recipe editor is active, the icon is green.
): If the
recipe editor is active, the icon is green.
Filter:
- Filter (
 ): A filter other than Filter 1 is called or selected.
- World (
 ): A world other than World 1 is
selected.
): A world other than World 1 is
selected.
Universe/Patch:
- Parked (
 ): If fixtures are parked, the icon is blue.
- DMX Tester (
 ): If the DMX tester generates output, the icon is white.
- Not Enough Parameters (
 ):
The limit of parameters is exceeded. If the system is in overload and the DMX output
refresh rate is
slowing down, Overload is displayed below the icon.
):
The limit of parameters is exceeded. If the system is in overload and the DMX output
refresh rate is
slowing down, Overload is displayed below the icon.
More:
- World Server (
 ): Displays if there is a connection to the world server.
- Battery (
 ):
Displays the power status of the console. On full-size, light, full-size CRV, and light CRV consoles, the icon is displayed by default. Tap the icon to open the battery status pop-up. For stations with no battery, the icon is crossed (
):
Displays the power status of the console. On full-size, light, full-size CRV, and light CRV consoles, the icon is displayed by default. Tap the icon to open the battery status pop-up. For stations with no battery, the icon is crossed ( ). For more information on the battery and power status, see UPS Battery.
- Phasers: Graphically indicates the current processing workload dedicated to phaser calculation in a bar in the command line. A green indicator rises with the number of parameters with actively running phasers. The exact value is displayed as a tooltip in the command line.
- Flow Control: Graphically indicates the current workload of the network with a green indicator in the bar next to the envelope icon () in the command
line. The exact intensity of the flow control is displayed on a scale of 0 to 255 as a tooltip in the
command line. The flow control level is also displayed in the network menu. For more information, see Session.
Toggles:
- Keyboard Shortcuts (
 ): If keyboard shortcuts are active, the icon is yellow.