Shapes
|
grandMA3 User Manual » Shapes
|
Version 2.4 |
A shape is an object containing a single recipe that defines how values are transferred between steps over time.
|
|
Hint: |
|
Shapes are most useful in combination with phaser recipes. Use shape objects in phaser
recipes to quickly and easily determine curves and other values in the recipe.
For more information on creating phaser recipes and using shapes in them, see recipes section. |
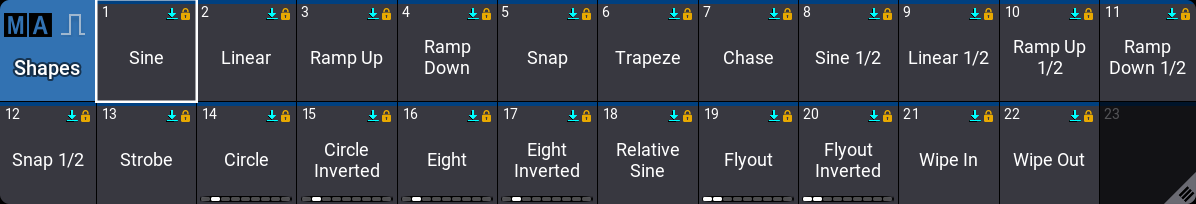
Shapes are stored in the shapes pool. To open this pool, see the Data Pools tab in the Add Window pop-up.
If a shape contains attribute information, a feature group indicator bar is displayed in the bottom of
the shape. White squares indicate that values of attributes of the corresponding feature group are stored in
the shape.
Shapes that are generic and do not contain attribute values do not have a feature group indicator bar.
There are 22 predefined shapes in the pool. Some predefined shapes are specific to an attribute, some are generic and can be applied to multiple or all attributes.
Shapes include Transition, Width, Acceleration, and Deceleration
values.
Additionally, Attributes, Speed, Measure, Adaptive Measure, Adaptive Width,
and Adaptive XY Rotation can be set in the
shape.
Shapes that contain information about one or more attributes can be called into the programmer and output directly. The values
that are set in the shape will be applied to the attributes that are defined in the shape for the current
selection.
If a generic shape is called into the programmer, the values that are set in the shape will be applied to
active attributes in the programmer with multi-step values.
To access the settings for the pool, tap MA in the upper left corner of the pool.
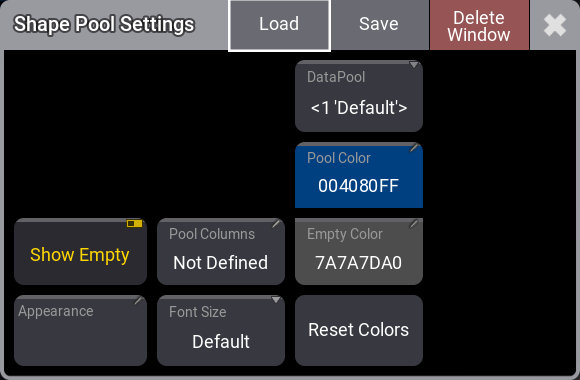
- Show Empty
This toggle button can hide or show empty pool objects. - Appearance
This sets which appearance is applied behind the pool objects. - Pool Columns
This defines the width for the pool objects. It does not change the size of the window. It defines how many columns of pool objects are in the window. If the window is wider than the number of columns, then the extra space is displayed as black (default color). If the window is smaller than the number of columns, the pool window can be scrolled horizontally. If the pool has a set width, then there is an icon ( ) in the upper right corner of the title field.
The Not Defined value dynamically sets the width to match the window size even when the window is resized.
The Take Current Width sets the width to match the current size of the window. It does not dynamically change if the window is resized. - Font Size
This sets the font size property from 10 to 32. There is also a default property. This is the same as size 18. This simply changes the font size on the pool objects. - DataPool
This defines what data pool the pool window shows data from. This makes it possible to have pools showing objects from different data pools. For instance, a group pool window from the default data pool can be shown next to a different group pool window showing groups from a different data pool. - Pool Color
This is the color for the title button in the pool. - Empty Color
This color is applied to empty pool objects. - Reset Colors
This resets the colors to the colors in the default color theme.
Edit Shapes
To edit a shape, use the swipey
gesture on the pool object or press Edit and tap the pool object.
The shape editor has two tabs. The sheet tab provides access to all properties of the shape in a sheet format,
the 1D tab provides a visualization of the shape in a 1D layout.
The 1D editor is also displayed in the context area of the recipe editor when you edit a shape or curve value in a phaser recipe.
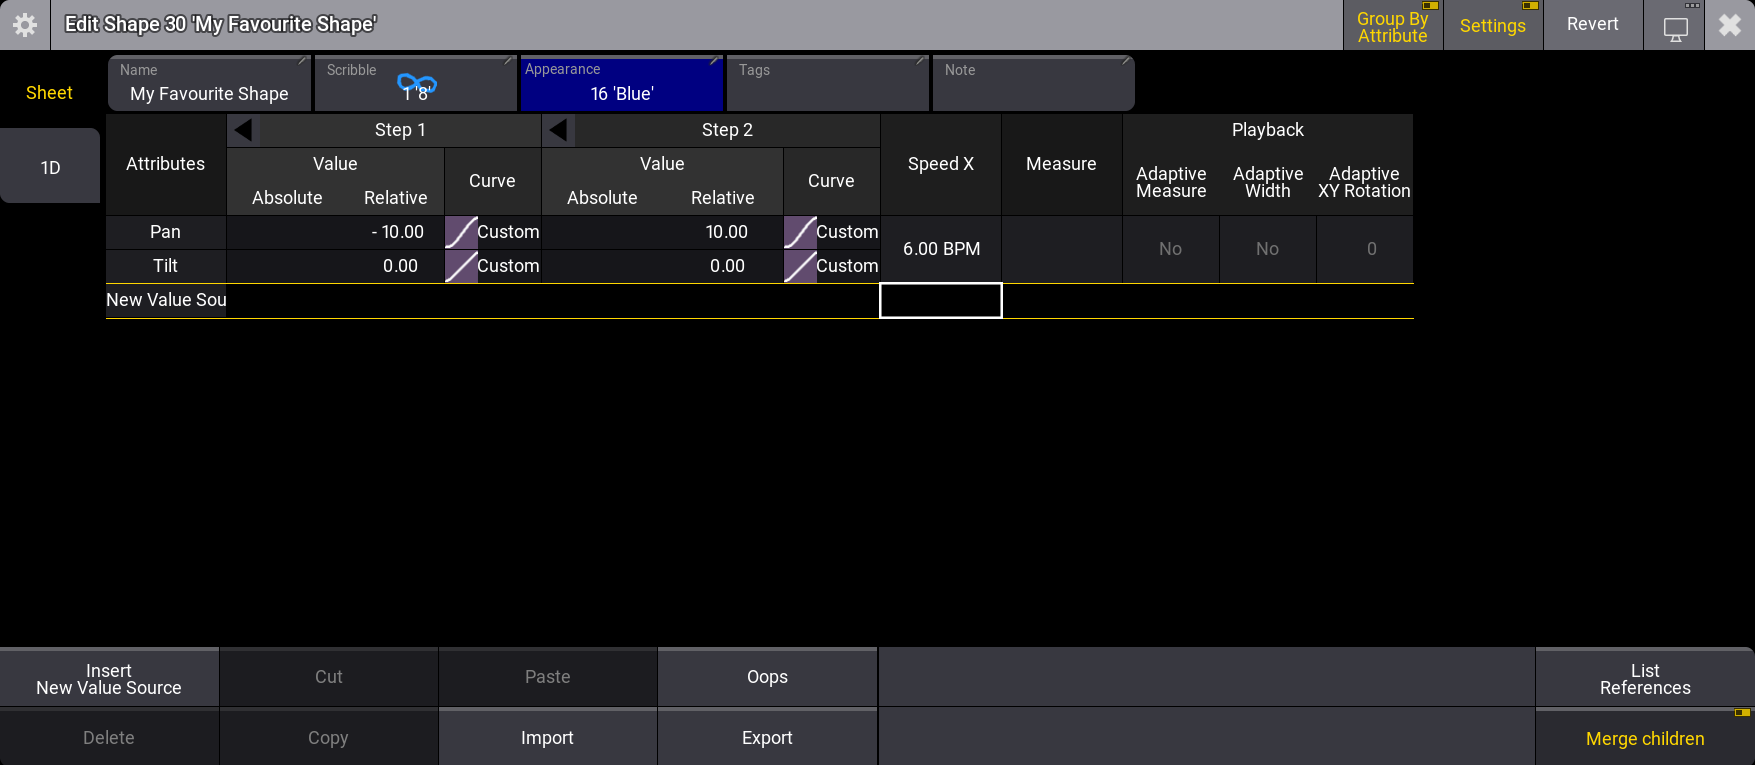
Sheet Tab
The sheet view provides access to the properties that can be defined in the shape. For more information about
these properties, see Recipe
Editor.

Properties that correspond to the same attribute are grouped in a numbered Value
Source header. Tap the arrow (![]() ) on the left of
the header to unfold or collapse the group and display more or less columns for the attribute. By default, the
group is collapsed. If multiple attributes are active in one phaser step, the attributes and their
corresponding values are displayed next to each other.
) on the left of
the header to unfold or collapse the group and display more or less columns for the attribute. By default, the
group is collapsed. If multiple attributes are active in one phaser step, the attributes and their
corresponding values are displayed next to each other.
To sort the recipe lines by attributes, enable Group by Attribute in the title bar. The grid layout changes. One recipe line now corresponds to one attribute. Properties that correspond to the same step are grouped in a numbered Step header.
1D Tab
The 1D tab provides quick and easy access to a 1D layout of the
attributes in the shape and Accel X, Decel X, Trans X, Width
X, Value Absolute, and Value Relative for each step.
The blue grid in the 1D layout displays the width on the x-axis with bolder separating lines at 100 %. The
step numbers are displayed in the center of each step.
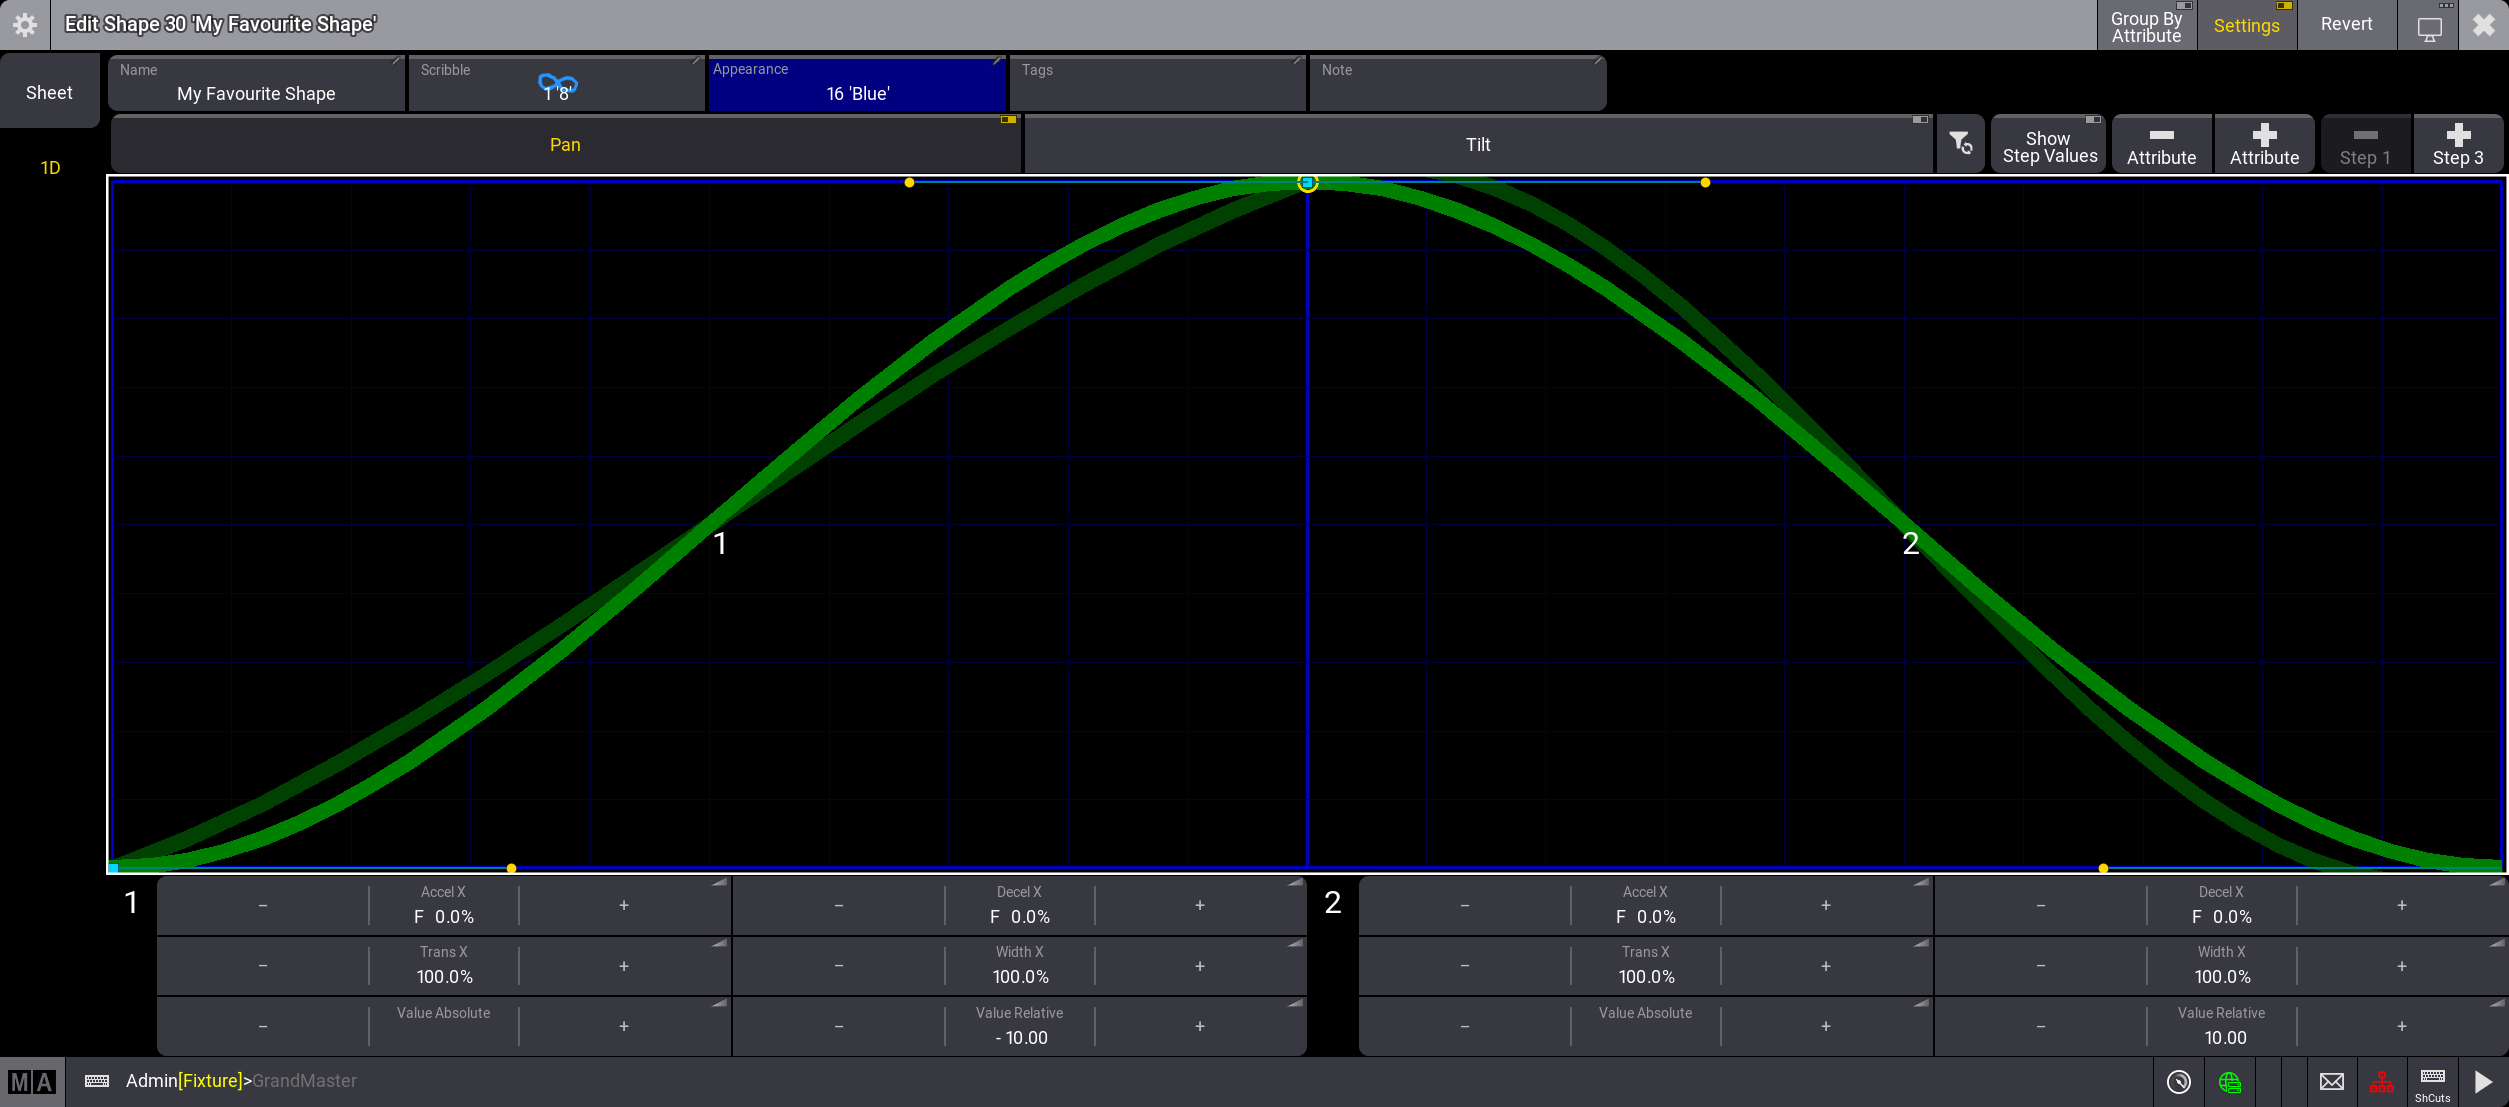
To modify the curves, move the handles or change the values in the buttons. The curves of all enabled attributes are modified collectively. If there are more than two steps, the two selected steps are highlighted in gray.
Attributes are displayed as toggle buttons at the top. To edit a shape of an attribute, enable the
corresponding button.
To display the curves of disabled attributes in a darker green color, enable Show
All Attributes in the settings. To hide the curves of disabled attributes, disable Show All Attributes.
In addition to the attributes, there are five buttons in the row above the 1D layout:

Enable or disable all attributes.- Show Step Values
If this button is disabled, the actual value range of the shape is displayed to span across the full height of the 1D layout. If it is enabled, the height of the 1D layout represents the full available range of values.  Attribute
Delete the selected attributes from a phaser recipe. Attribute
Add an attribute to the shape.- Step
Delete the selected step of a shape. The number of the step that is to be deleted is displayed in the button. - Step
Add a step to a shape. The step is added at the end of the phaser.
Title Bar and Settings
There are four buttons on the right side of the title bar in the shape editor.
- Group By Attribute
Tap to change the grid layout in the sheet tab so the rows correspond to attributes. - Settings
Enable to set Name, Scribble, Appearance, Tags, and Note in the shape. - Revert
Tap to return the shape to the state before you opened the editor. 
Select a different screen to display the shape editor on.
To access the settings of the shape editor, tap ![]() in
the upper right corner of the editor.
in
the upper right corner of the editor.
Settings in the Sheet column only apply to the sheet tab, settings in the 1D column only apply to the 1D tab.
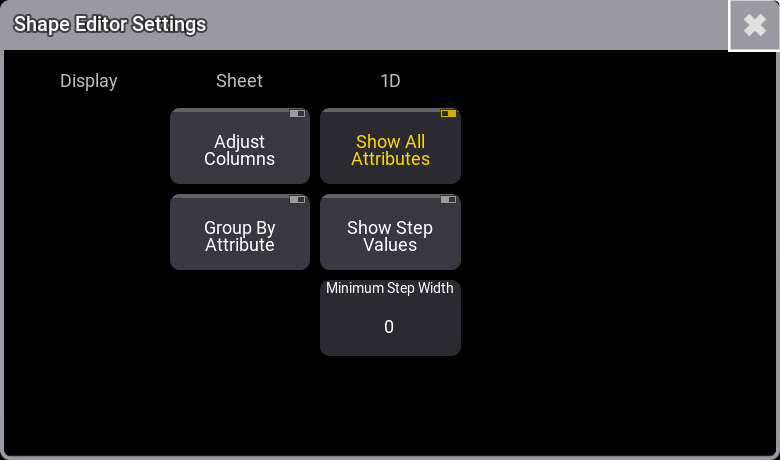
Sheet
- Adjust Columns
This On/Off button makes a sheet adjust the column width to match the window size and the number of columns. - Group By Attribute
Tap to change the grid layout in the sheet tab so the rows correspond to attributes.
1D
- Show All Attributes
Toggle to show or hide the curves of disabled attributes. If Show All Attributes is enabled, curves of disabled attributes are displayed in a darker green color. - Show Step Values
If this button is disabled, the actual value range of the shape is displayed to span across the full height of the 1D layout. If it is enabled, the height of the 1D layout represents the full available range of values. - Minimum Step Width
Define a minimum width for the steps in the shape.