Status Center
|
grandMA3 User Manual » System » Message and Status Center » Status Center
|
Version 2.4 |
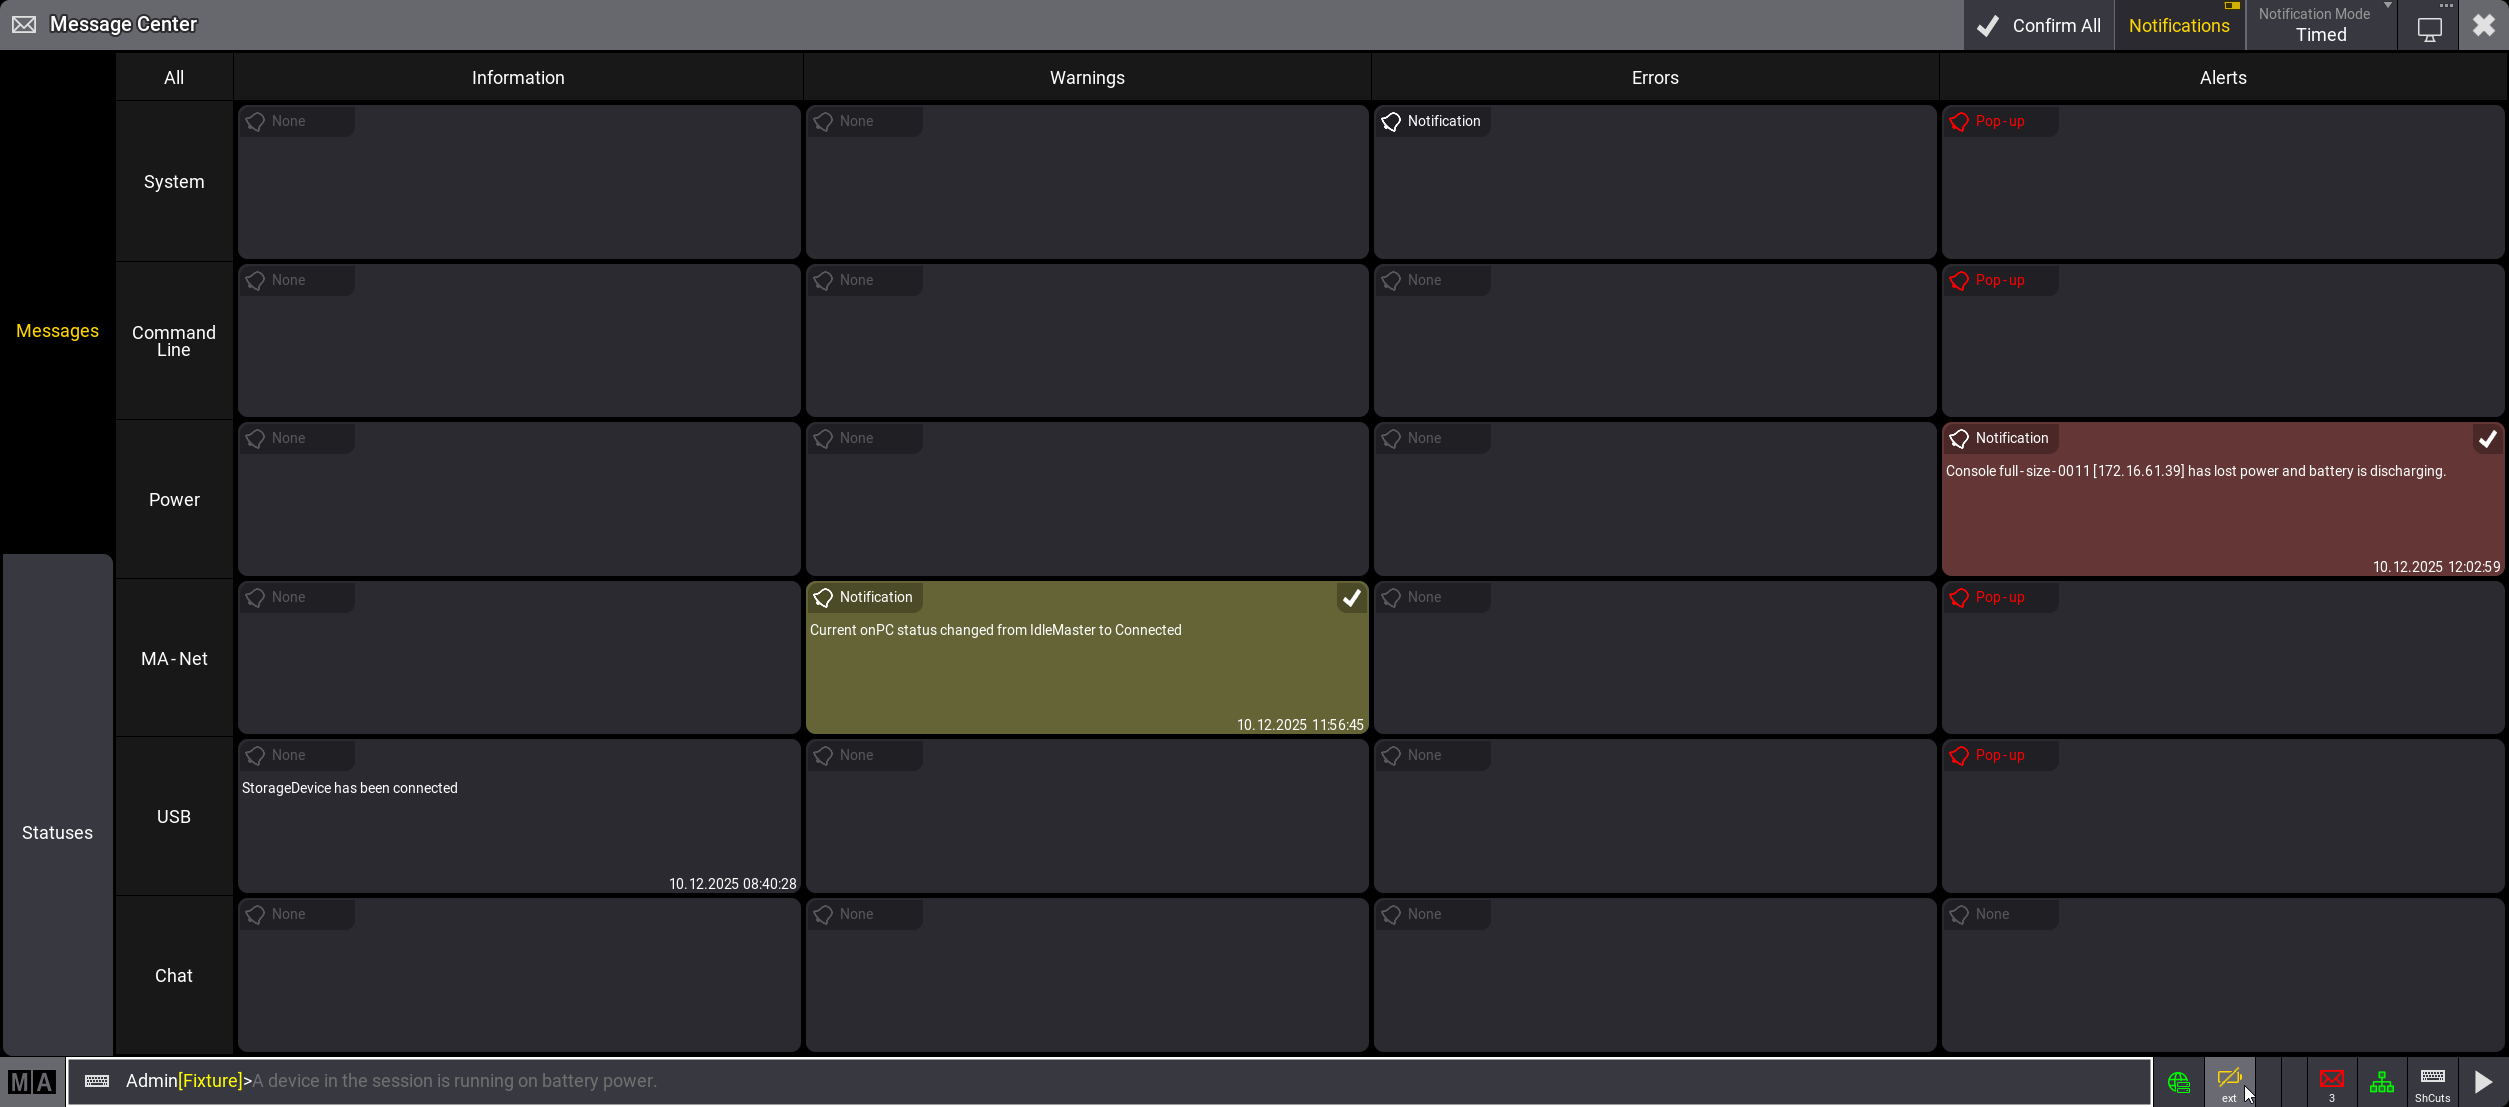
Status icons indicate activities and statuses in the software. They are displayed on the right side in the command line next to the command line input field.
All status settings are set per user profile. For some statuses you can choose to see the corresponding status for all user profiles.
To show or hide a status icon in the command line, swipe the status in the message center window.
A drop-down
displays
the
following options:
- Never: No icon for the status is displayed. The indicator bar of the corresponding status is gray.
- On Activity: Displays the icon when a setting or function is active. The indicator bar is white.
- Always: The icon is always displayed in the command line. If the setting or function is not active, the icon is grayed out. The indicator bar is green.
Most statuses additionally have three Blink options:
- None: The background of the status in the command line does not blink when the status is active.
- Once: The background of the status blinks red once when active.
- Always: The background of the status blinks red continuously when the status is active.
|
|
Hint: |
|
For the statuses Highlight, Blind, Solo, Grand
Master, World Master, and Disk Space "Blink" is set to
Always by default.
|
Additionally, the icon and title bar of a status light up in the corresponding color if the status is active.
The default display mode for statuses in the Programmer, Filter, and Universe/Patch section is On Activity.
The default display mode for statuses in the More and Toggles section, except for Battery, is Always. The default
for Battery depends on the device.
For some statuses (Highlight; Lowlight; Solo; Timecode Record) you can select different sources for the status in the drop-down:
-
My: The status is active if triggered by the current user profile. If My is selected as user profile,
 is displayed in the status cell.
-
All: The status is active if triggered by any user profile. If All is selected as user profile,
 is displayed in
the status cell.
is displayed in
the status cell.
|
|
Hint: |
| If the user profile is set to All and highlight, lowlight, solo, or a timecode record is triggered by another user profile, ext or my+ext is displayed below the icons. ext is displayed if the function is only triggered by another user profile. my+ext is displayed if the function is triggered by both the current and another user profile. If the function is triggered by the currently active user profile, no text is displayed below the icon. |
The following statuses are available:
Programmer:
-
Highlight (
 ):
Highlight is active. Tap the icon to open the temporary master controls.
):
Highlight is active. Tap the icon to open the temporary master controls.
-
Lowlight (
 ):
If Lowlight is active, the icon turns blue. Tap the icon to open the temporary master controls.
):
If Lowlight is active, the icon turns blue. Tap the icon to open the temporary master controls.
-
Solo (
 ):
Solo is active. Tap the icon to open the master controls.
):
Solo is active. Tap the icon to open the master controls.
-
Blind (
 ):
Blind is active. Tap the icon to open the master controls.
):
Blind is active. Tap the icon to open the master controls.
-
Preview (
 ): If Preview is active, the icon is orange.
-
Timecode Record (
 ): A timecode recording is active. When a timecode is recorded, the icon starts to
blink. Tap the icon to open the off menu in the timecodes tab.
): A timecode recording is active. When a timecode is recorded, the icon starts to
blink. Tap the icon to open the off menu in the timecodes tab.
-
Recipe Editing (
 ): If the
recipe editor is active, the icon is green.
): If the
recipe editor is active, the icon is green.
-
Grand Master (
 ): Grand master is not at full. Tap the icon to open the temporary master controls.
 -
World Master (): World master is not at full. Tap the icon to open the temporary master controls.
-
Grand Rate (): Grand rate master is not at 1:1. Tap the icon to open the temporary master controls.
Filter:
-
Filter (
 ): A filter other than Filter 1 is called or selected.
-
World (
 ): A world other than World 1 is
selected.
): A world other than World 1 is
selected.
Universe/Patch:
-
Parked (
 ): If fixtures are parked, the icon is blue.
-
DMX Tester (
 ): If the DMX tester generates output, the icon is white.
-
Not Enough Parameters (
 ):
The limit of parameters is exceeded. If the system is in overload and the DMX output
refresh rate is
slowing down, Overload is displayed below the icon.
):
The limit of parameters is exceeded. If the system is in overload and the DMX output
refresh rate is
slowing down, Overload is displayed below the icon.
-
No Fixtures Patched (
 ): No fixtures are patched in the current show.
-
Patch Open (
 ): Another user is in full patch.
More:
-
World Server (
 ): Displays if there is a connection to the world server.
-
Encoder Bar (
 ): A different encoder bar and not the default encoder bar is selected.
 - Phasers: Graphically indicates the current processing workload dedicated to phaser calculation in a bar in the command line. A green indicator rises with the number of parameters with actively running phasers. The exact value is displayed as a tooltip in the command line.
-
Flow Control: Graphically indicates the current workload of the network with a green indicator in the bar next to the envelope icon (
 ) in the command
line. The exact intensity of the flow control is displayed on a scale of 0 to 255 as a tooltip in the
command line. The flow control level is also displayed in the network menu. For more information see Session.
) in the command
line. The exact intensity of the flow control is displayed on a scale of 0 to 255 as a tooltip in the
command line. The flow control level is also displayed in the network menu. For more information see Session.
Hardware:
- Battery (
 ): Displays the power status of the device. On full-size, light, full-size CRV, and light CRV consoles, the icon is displayed by default. Tap the icon to open the battery status pop-up. For stations with no battery, the icon is crossed (
 ).
).
If a device runs on battery, the system differentiates between the battery status of your own device and those of other devices in the session. Depending on the configuration, ext or my+ext is displayed below the icons to indicate which device is affected. ext is displayed if a different device is affected, my+ext is displayed if the current device and a different device are affected. If the current device is affected, no text is displayed below the icon. The tooltip in the command line and alert message in the message center provide further information. For more information on the battery and power status, see UPS Battery. - USB Network (
 ): USB network is active. This status is not available in the onPC software. For more information, see USB Network in Features.
-
ShowData (
 ): Previously named Memory.
-
CPU (
 ): Displays the CPU usage as a percentage below the status icon in the command line.
-
Memory (
 ): Displays the memory usage in MB below the status icon in the command line.
-
CPU Temperature (): Displays the CPU temperature in °C below the status icon in the command line.
-
GPU Temperature (
 ): Displays the GPU temperature in °C below the status icon in the command line.
-
Fan Speed (
 ): Displays the fan speed as a percentage below the status icon in the command line.
-
Disk Space (
 ): Displays the available free space in GB of the HDD below the status icon in the command line.
Toggles:
-
Keyboard Shortcuts (
 ): If keyboard shortcuts are active, the icon is yellow.