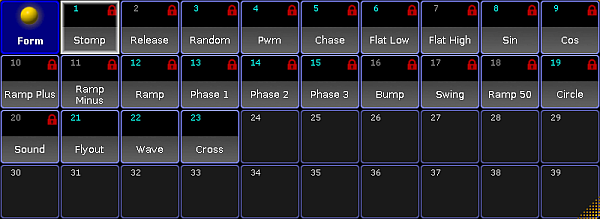
Like the image pool, the form pool displays red padlocks. For more information on padlocks and their meanings see Image Pool.
Important:
Forms are locked so that predefined effects can fall back to the default values.
To edit an already existing object blocked by a red padlock, press Copy, then tap the object containing the red padlock, and then tap an empty cell in the pool.
Then, press Edit and tap the object you have copied.
To create a new form, press Edit and tap an empty cell in the form pool.
The graph editor opens.
Form pool – graph editor
Settings in the Graph Editor
Then, set the focus by tapping the line.
Tap Add Point and move the line in one of the four directions.
Important:
If the focus is not precise, the line jumps to the point that was inaccurately set.
To remove a point, tap Delete Point.
To add an additional graph, add Add Graph.
Hint:
It is also possible to lock graphs so that you do not slip when editing various graphs in a row.
To lock a graph, tap Lock Graph.
To unlock graphs, tap Unlock all Graphs.
Depending on the form of the graph, it is possible to visualize it in 2D.
-Tap 2D Mode.
If you have several graphs, it is possible to link them.
-Tap Link Graphs. Editing in one of the graphs linked together, applies the modification in all graphs linked. If the button is enabled, the font is displayed in yellow.
-To delink the graphs, tap Link Graphs again. The font is now white.
Change the color of the graph:
-Tap the name of the form displayed on the right or tap the graph you would like to change and then tap Change Color.
-The pop-up Select Color opens containing a color picker.
-Select the color and tap Please.
-The color of the graph is now adjusted.
Label the graphs of a form:
-Tap the name of a graph displayed on the right or tap the graph in the editor and then tap Label Graph.
-The pop-up for entering names opens. Type the name and press Please.
-The graph is now labeled.
Label the form in the form pool:
-Tap Label.
-The pop-up for entering name opens. Type the name and press Please.
-The form is now labeled.
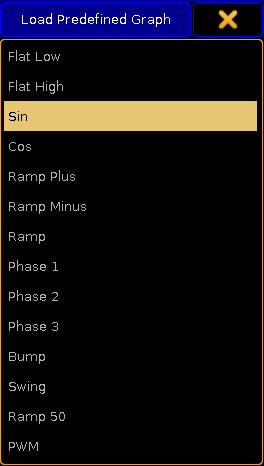
It is possible to use predefined graphs as well:
-Tap Load Predefined on the right of the graph editor.
-The pop-up Load Predefined Graph opens.
Pop-up – predefined graphs
Tap to choose a form.
-The form is instantly applied.
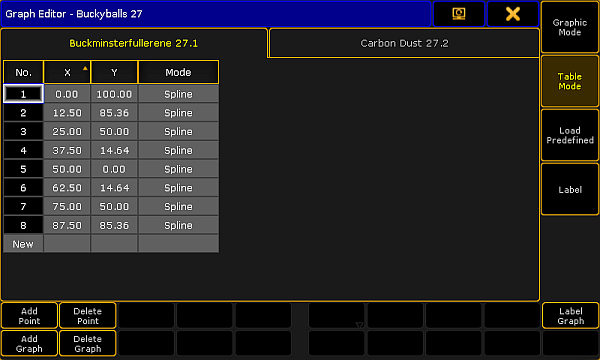
Table Mode
To display the graph in form of a table, tap Table Mode on the right of the graph editor.
The graph editor is now displayed in the table mode.
Graph editor in table mode
The table mode consists of a table and tabs.
Each tab stands for a graph.
The columns X and Y represent the position of points.
The column Mode stands for modes of points.
To manually adjust the positions X and Y, tap and hold a cell or press the key Edit and tap a cell in the corresponding column.
-The calculator opens.
-Adjust the position and tap Please.
-Position is modified.
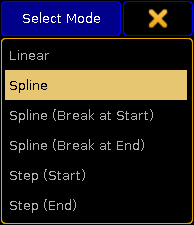
Set the mode:
-Tap and hold a cell or press the key Edit and tap a cell in the column Mode.
-The pop-up Select Mode opens.
Pop-up showing modes
-Tap to choose a mode.
-The mode is applied.
To add a new point, tap and hold the cell in the line New at the bottom of the table.
To switch back to the graphic display, tap Graphic Mode.
Modes
The modes are applied between two points.
Linear:
Creates a straight line between two points.
Spline:
Creates a soft-edged line intersecting the points.
Spline (Break at Start):
Creates an edged corner on the point that was marked (tapped) and a curve between the point marked (tapped) and the following point.
Spline (Break at End):
Creates an edged corner on the point following the point that was marked (tapped) and a curve between these two points.
Step (Start):
Creates a step leading from the point marked (tapped).
Step (End):
Creates a mirror-inverted step form the point following the point that was marked (tapped).
If all setting were adjusted accordingly, close the graph editor:
-Tap in the upper right corner of the window and the editor closes.