
Performance window
To access the Performance window, tap on an empty part of a screen. This must be at least 2 columns wide and 2 rows high. Tap System and then Performance.
The Performance window opens.
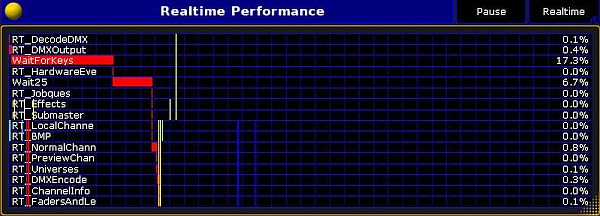
The performance window is a monitor of internal workloads and a debug tool. It has two different modes, Realtime and Draw. As default it opens in realtime.
It is a monitor of the workload of the desk. The first six rows are incoming traffic and the last rows are outgoing traffic.
The different loads have different colors:
- Red - DMX data
- Green - MA Net feedback
- Blue - Station feedback (MA stations = 1 ms / Windows > 1 ms)
- Yellow - Network Protocols
The lines on the left side of the view are showing tasks with a high calculation priority. The lines on the right side shows tasks with a normal priority.
The small line that are only 2 rows high, show traffic via USB connections (Command and Fader Wing for example) while the long lines that are 8 rows high, show traffic via ethernet or DMX.
The traffic for incoming USB connections are on line 7 and 8, while outgoing USB traffic is on line 9 and 10.
If the yellow lines (Art-Net traffic for example) are shown side by side in the lower part, then there is a delay on the outputted universes. To adjust this delay go to Setup - Network – Network Protocols and adjust the Delay column.
There are two buttons in the upper right corner of the Performance window
- Pause freezes the display
- Realtime/Draw switch the window between Realtime and Draw
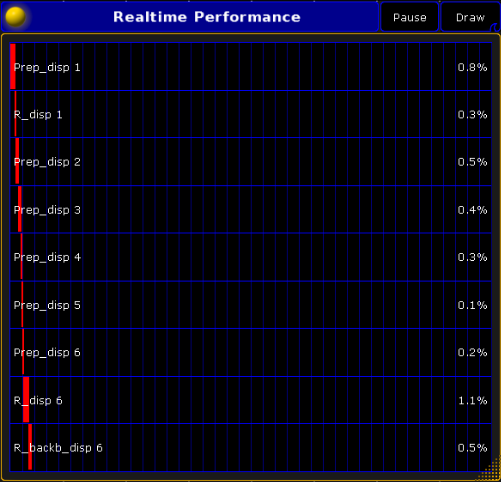
This window shows the resources allocated to drawing the screens. Each displays has its own row.